

Land analysis for planting strawberry trees: maps, constraints and numbers
Before you plant, see your land the way we see it.
Terrain, soil, water, what the law allows and how much it can yield. All in one study, done before you spend the first euro on the land.
The first question is not “how much does planting cost?”
It is where, how and whether it is worth it.
Planting in REN without knowing
Much of inland Portugal lies in the National Ecological Reserve or has some ICNF restriction. Planting is often possible, but you must notify and follow the rules. Finding out later can stop the works.
Protected trees
Cork oak and holm oak stands, among other species, are protected by law. They must be identified and kept out of the orchard before the land is prepared.
Underestimating the slope
Above certain slopes the planting spacing changes, preparation costs more and maintenance costs can be much higher. This changes the whole budget.
Forgetting the water
With irrigation, an orchard can produce several times more. Without a licensed water source, the numbers are very different.
Applying with the wrong area
Not all land is eligible for every support scheme. And there are factors that add points to an application that many people miss.
 TodayAreas with potential
From scrubland to an orchard designed to the metre.
Real example: on a 33 ha property in the Odemira hills, 75% of the area had potential for strawberry trees, the protected trees were preserved and, with grants, payback came in year 4.
Drag the image. On the left, the property today; on the right, what the analysis shows:
- Gentle to moderate slope: plant without terraces
- Steep: plant with wider row spacing
- Very steep: to be fine-tuned on site
- Cork oak stand: protected, left as it is
- Large trees: to be assessed on the site visit
75 % of the property with potential, the cork oak stand preserved and a planting spacing designed for each zone.
I want to see my land like thisFive questions every project has to answer.
Each map answers a concrete decision. Below are five of the roughly 35 maps that make up a complete mapping study.
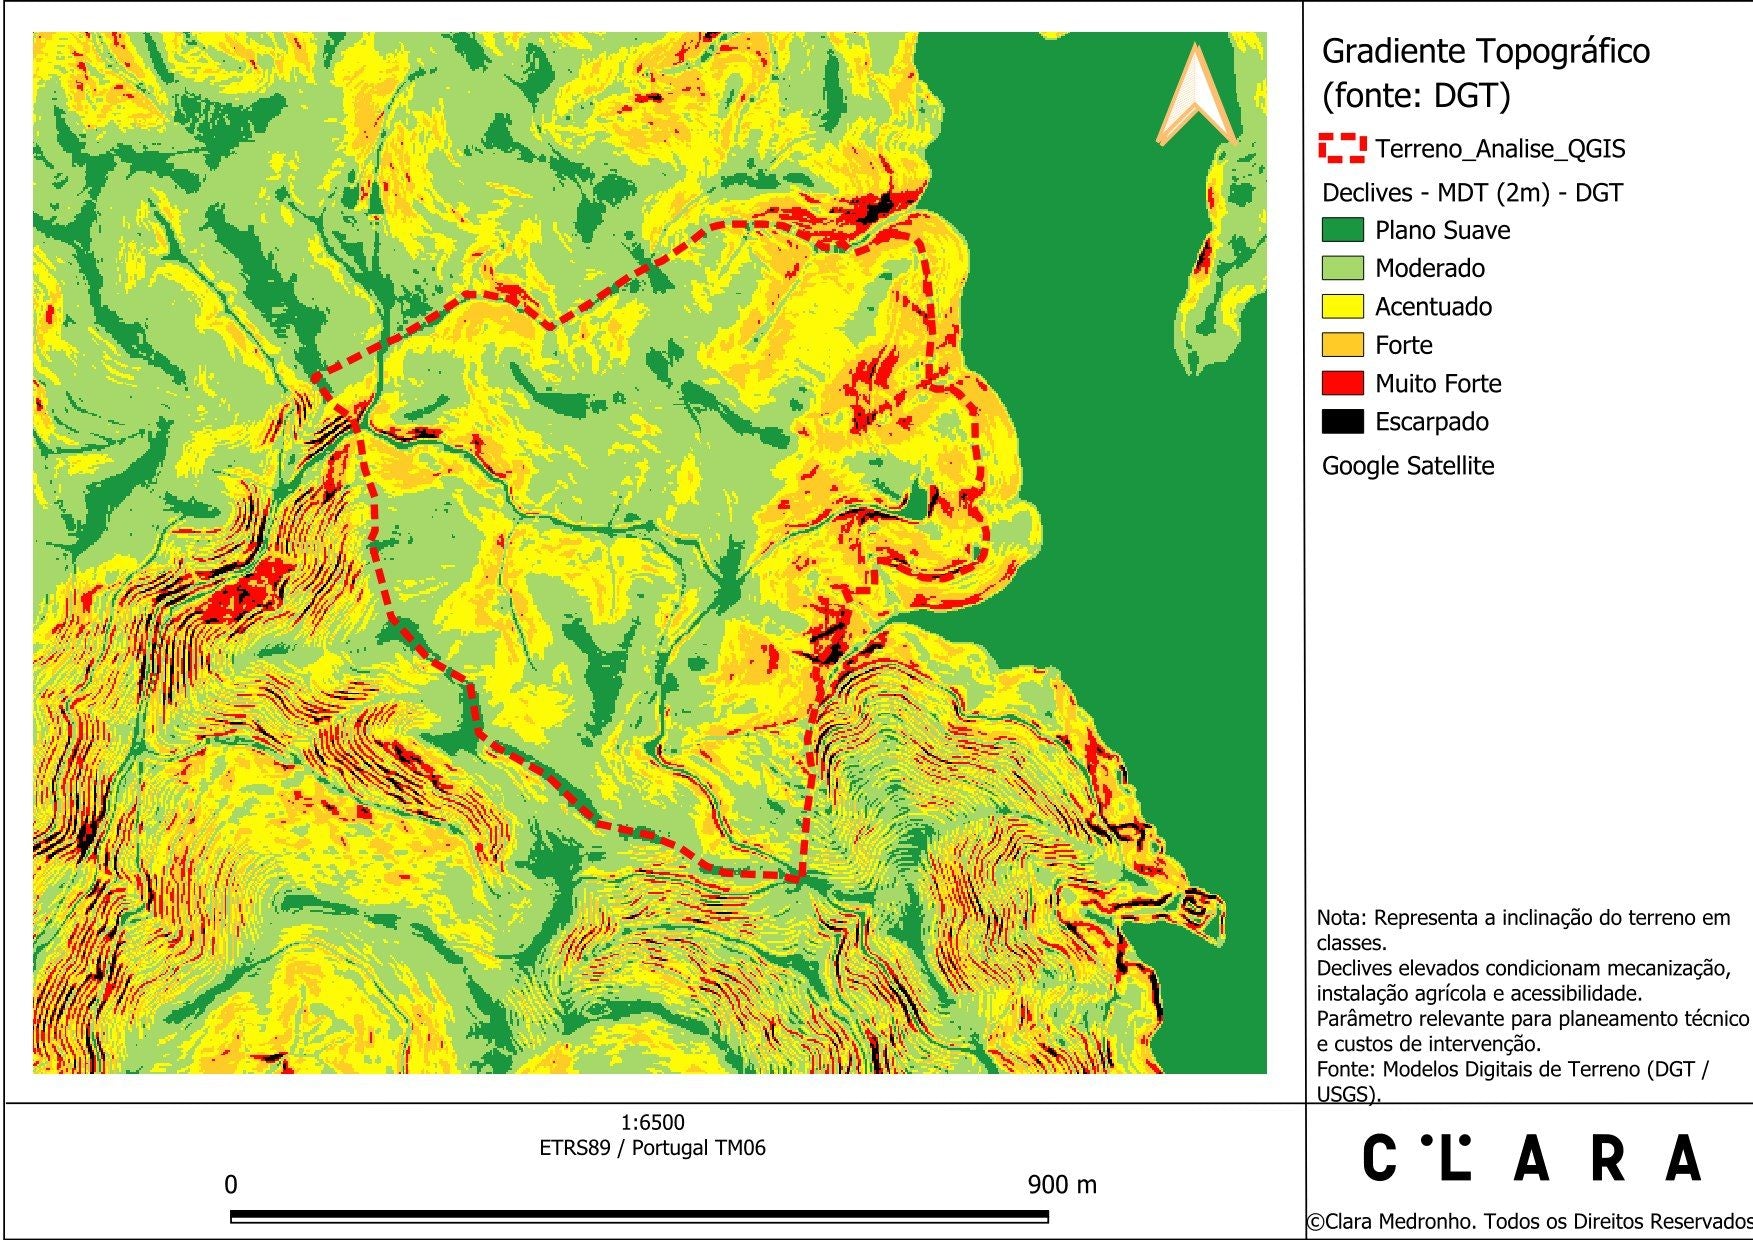
Where to plant and at what spacing?
Slopes at 2 m resolution: where machinery can work, where to widen the rows, where it is not worth it.
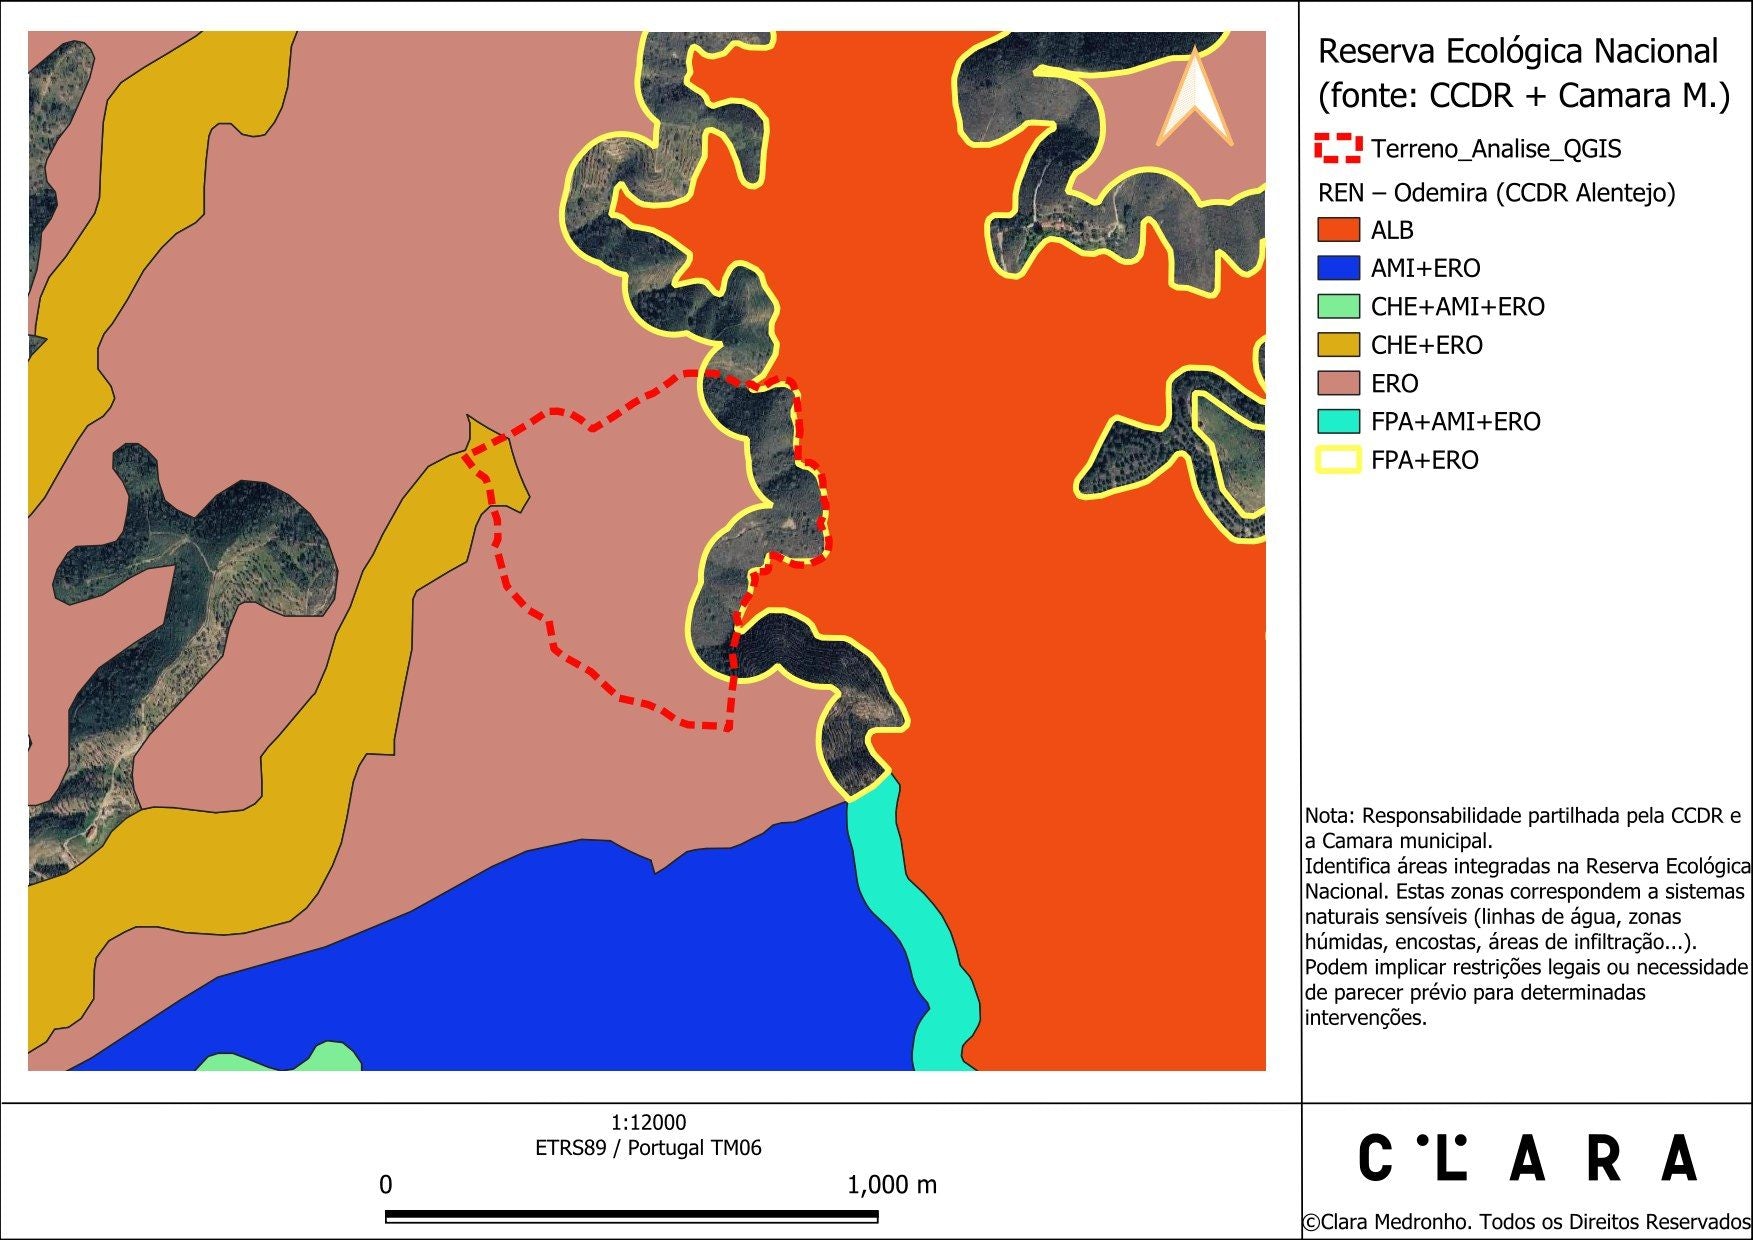
What can I do and what must I notify?
REN, RAN, Natura 2000, municipal plan (PDM), forestry plan (PROF), cork oaks and fuel management strips over your property boundary.

How to lay out the planting rows?
Altitude and contour lines every 10 m: the basis for designing rows, tracks and drainage along the contour.

Will the strawberry tree thrive here?
Soil pH, texture and depth, slope aspect, altitude and the source of irrigation water.

What support and bonuses does the land have?
Less-favoured areas, desertification, fire risk, Local Action Group and IFAP history.
Every restriction translated into a decision.
We don't hand you a list of acronyms. For each one we tell you what it means on your land: go ahead, notify, confirm, or leave out.
Extract from the real example.
| National Ecological Reserve (erosion) | Possible, with notice to the CCDR |
| National Agricultural Reserve | No restriction |
| Natura 2000 and protected areas | No restriction |
| Forestry plan (PROF) | Strawberry tree eligible |
| Municipal master plan (PDM) | PDM and CRUS checked |
| Cork oak stand | Land use map + site visit |
| Fuel management strips | Minimal |
The map decides the numbers.
With the real planting area and the spacing for each zone, the financial study stops being a catalogue average and becomes your number. In the same example, about 25 ha of orchard:
Orchard · 25 ha
e.g. Young Farmer schemeYear 4
Example figures, simplified and before tax. Every property has its own numbers.
The same orchard pays for itself in year 4 instead of year 11. This is the kind of decision you make before planting, not after.
These figures are only a summary. The full financial study we deliver includes:
- NPV and IRR over 20 years
- Annual cash flow map
- Investment by item and sub-item
- Scenarios with and without support
- Price and yield sensitivity
- Working capital needs
How much could your land yield?
Request an estimateA study to decide with, not a pile of paper.
From first contact to decision.
Talk to us
A short conversation about the land and what you want: fruit, brandy, forestry, a funding application.
We identify the property
The location or the land register document is enough. We take care of the cadastral boundary.
We run the analysis
Mapping, restrictions, technical proposal and financial study.
You decide with confidence
We present the results and validate them on site before moving forward.
Before you ask, you may want to know
I already know I want to plant. Do I really need this?
Those who have already decided to plant benefit the most: the study tells you where, at what spacing and with what investment. And it avoids discovering a restriction halfway through the works.
Do the maps replace a site visit?
No. Official mapping provides the framework and saves time and money. The visit confirms and finalises the area, the trees to keep and the spacing.
What about the drone?
When useful, a drone flight during the visit complements the official mapping with up-to-date, detailed imagery of your land.
Can it be used for a PEPAC funding application?
Yes. The analysis identifies the eligible area, previous commitments on the land and the factors that can increase the application's score. It is the basis of the project.
What if the land is not suitable?
You find out before investing, with the reasons shown on a map. There are often alternatives: another part of the property, an agroforestry system or a forestry project.
How much does the analysis cost?
From €325, including mapping, legal constraints, a technical proposal and a financial study.
How long does it take?
Usually 2 to 3 weeks once the property has been identified.
Can I plant strawberry trees on REN land?
Often yes: Portugal's National Ecological Reserve (REN) does not ban all planting, but it may require prior notification and rules such as planting along contour lines. The analysis tells you what applies to your land.
Is my land suitable for strawberry trees?
That is the question the analysis answers: we cross-check slope, soil, aspect, water and constraints, tell you how many hectares have potential and at what spacing, and point you to the most suitable grant call to apply for.
A well-founded decision costs far less than a mistake on the ground.
Tell us where the land is and what you have in mind. We will get in touch to understand your project and send you a no-obligation proposal.
- Farmers with our own strawberry tree orchards
- More than 800 hectares analysed and supported
- From the study to the application and the planting
Mapping: DGT (LiDAR, COS, CRUS, orthophotos), ICNF, CCDR, IFAP, DGADR, APA. Real example shown without identifying the property or its owner.